SeekBeak Reports Guide: Powerful Data Analytics for 360 Photos

SeekBeak is proud to offer the most comprehensive data tracking reporting suite available on any 360 photo, virtual experience, or virtual tour platform.
Using our reports, you can really understand what users are interacting with and responding to. Your clients will love being able to track which images are bringing in traffic and which ones are really engaging potential customers.
As our reporting is built in, and not subject to browser ad-blocking like external tracking solutions are, you get actual real world stats.
Graph and compare your data, or export it for usage in your own tools, getting a long-term view of how things are performing.
Hotspot Click Report
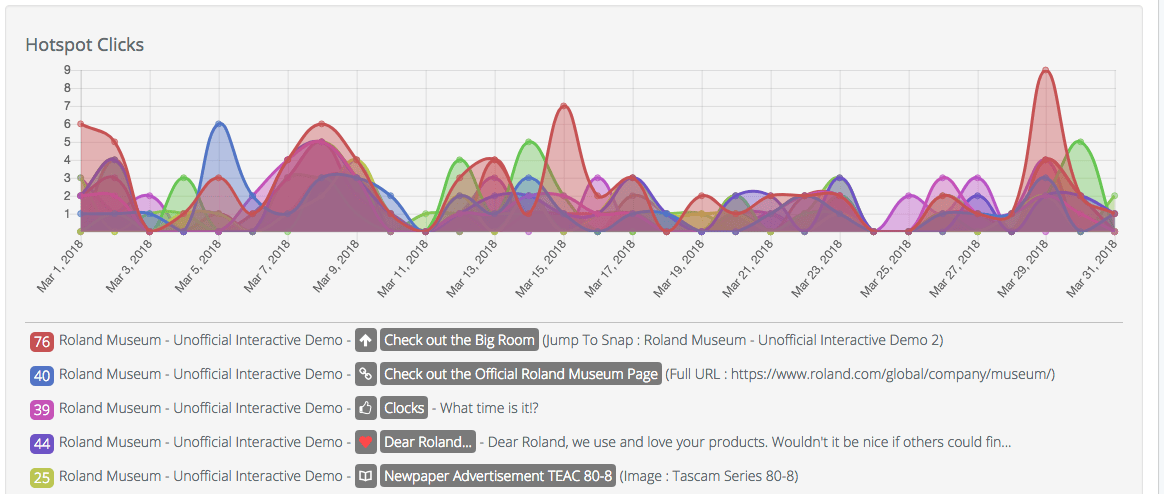
The Hotspot Click report tells you how many clicks each of your hotspots have received. This powerful report can help you see which content is interests audiences the most.
You could track leads generated from Snap by tracking links or phone call hotspots. See how many people are exploring secondary content like text, images, and videos etc.
Active Duration Report
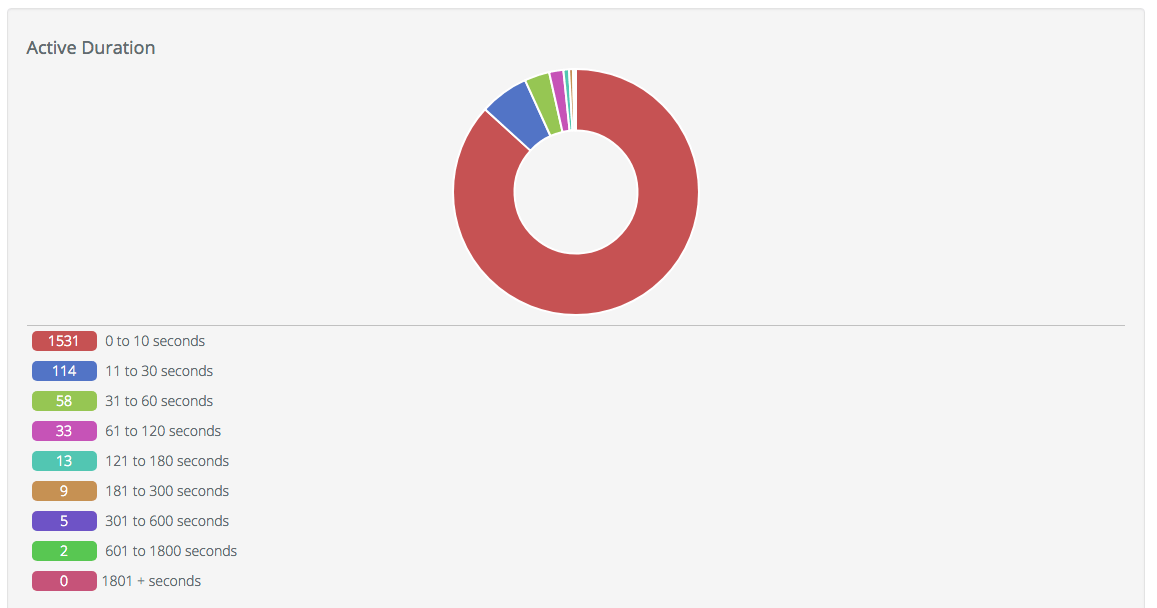
This report tells you how long people are staying on each Snap. Use this to learn which Snaps are most visually engaging and if your content is encouraging people to explore the image and hotspots.
Browser Report
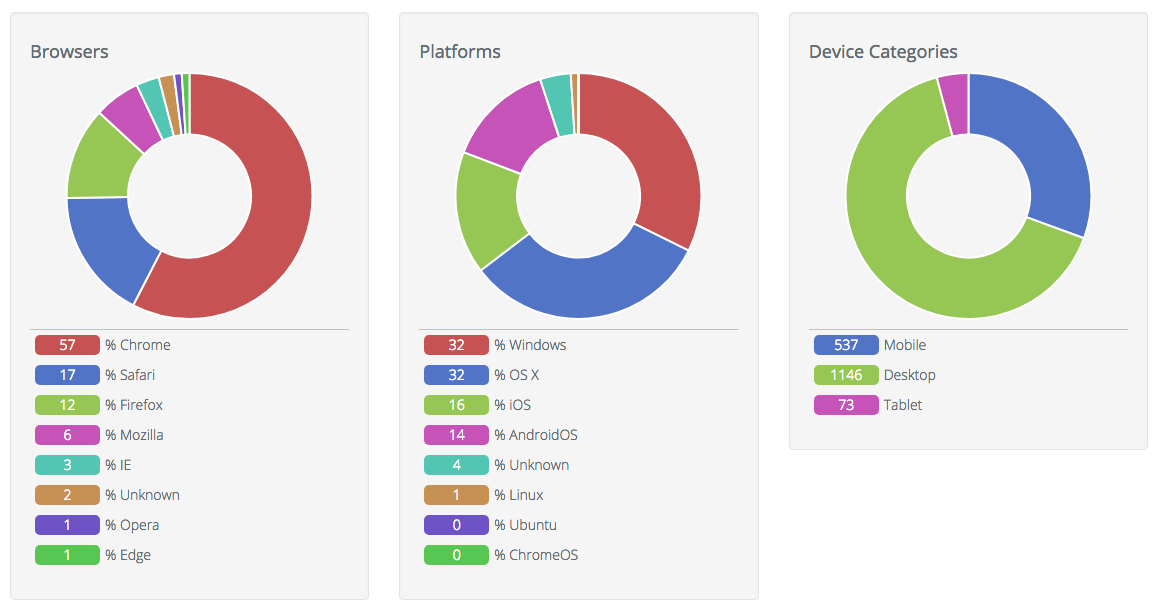
This report is broken into 5 sections, 3 of which are shown here:
- Browsers - Which internet browser your users are using to view your Snap
- Platforms - Which operating system your users are using
- Device Category - Is your traffic from Mobile, Desktop, or Tablets? This information is very important for designing your website. All SeekBeak snaps are completely mobile and tablet friendly
- Devices - Learn which computer models or mobile phones are most popular with your audience
- Top 20 Countries - This shows you where in the world your audience is coming from.
Visit Count Report
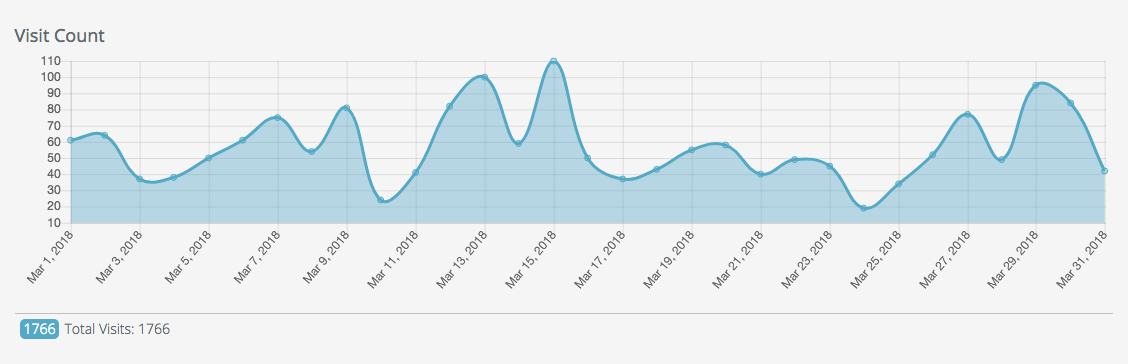
This report is great for tracking the popularity of your image over time. You can use it to see patterns in website traffic, spikes in interest, or seasonality effects.
Social Sharing Report
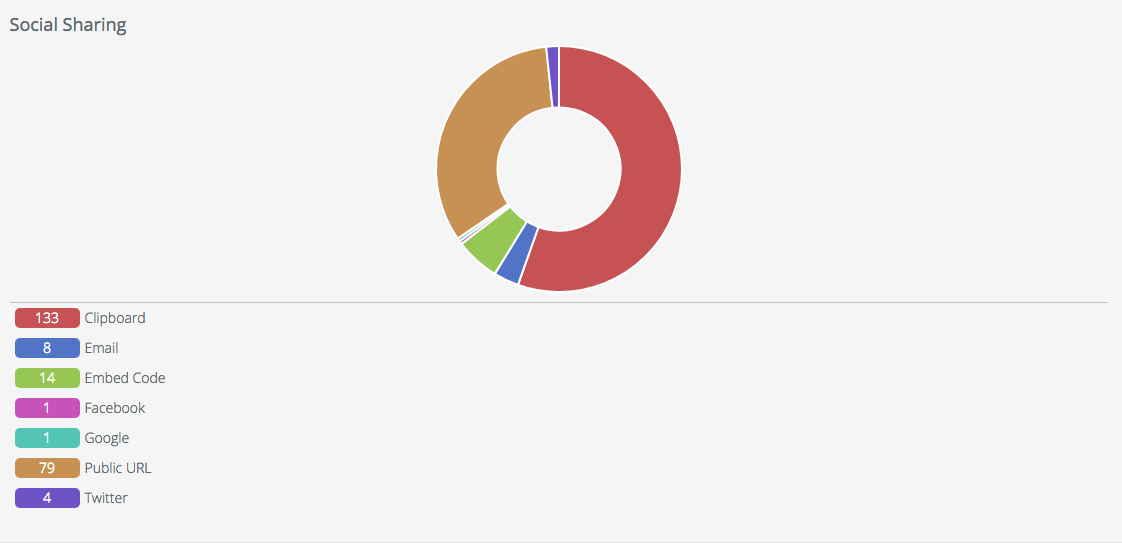
Want to know how your Snap is being shared? This report will give you all the ways people are sharing your content.
Heatmap Report
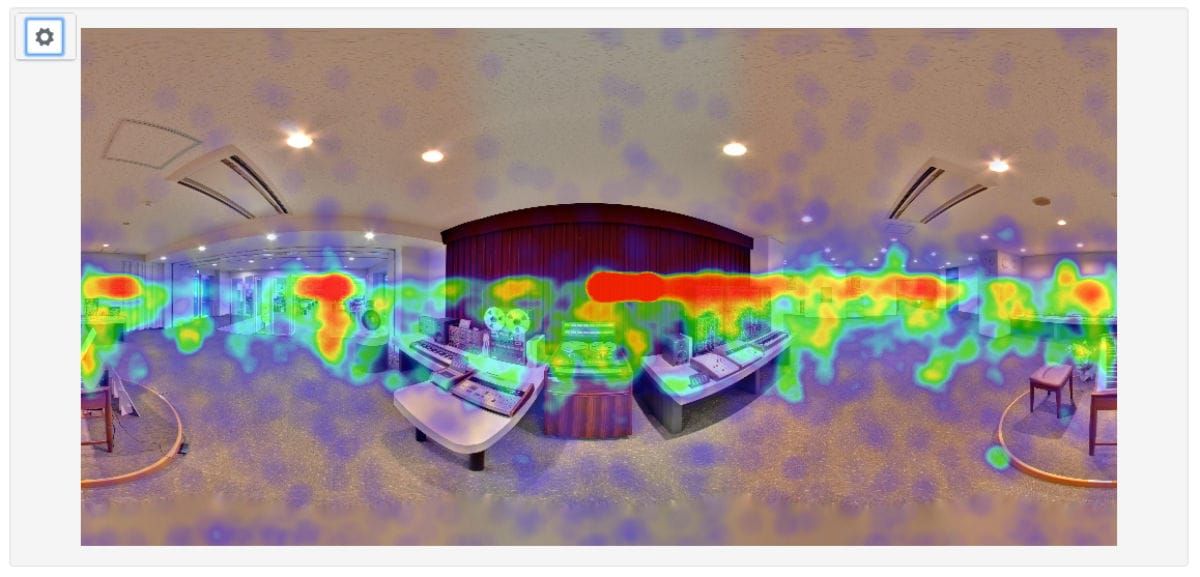
Heatmap Reports are a very unique feature of SeekBeak. We're the only platform that allows you to see where exactly your audience viewed the 360 photos.
You'll be able to spot particular points of interest to users, and where they lingered. Use the "gear" icon in the top left to control the size and radius of the blobs, the overall blur/blending, as well as the scale of the entire chart.
Export it all as an image and include it in your KPI reports to clients or management!
Snap List Report
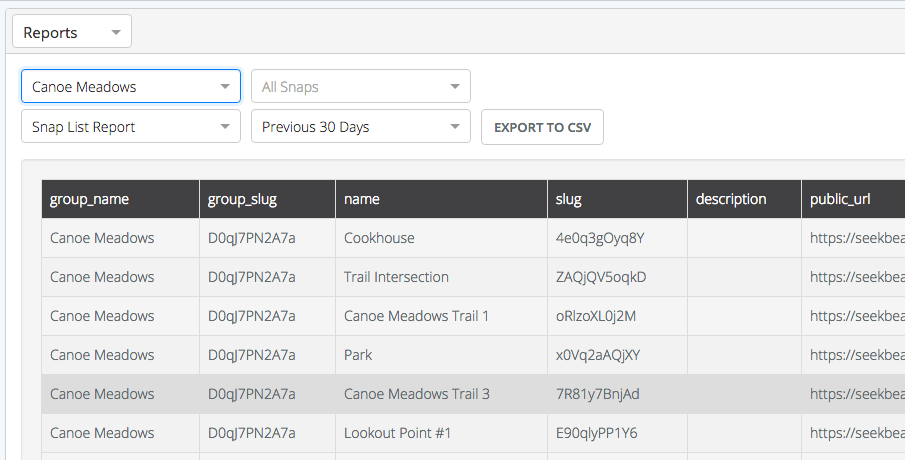
This report allows you to generate a simple listing of all your Snaps, with their individual and group identifiers, complete with public links.
Generate group-based Snap lists for your clients, real estate properties, customers, classrooms, or whatever you're using SeekBeak for! No more opening up a Snap, copying and pasting the URL, and moving on to the next one.
You can now easily print off an entire listing of all the Snap URLs in a group, grab the columns that are important to you, and send it off!
Form Field Breakdown Report
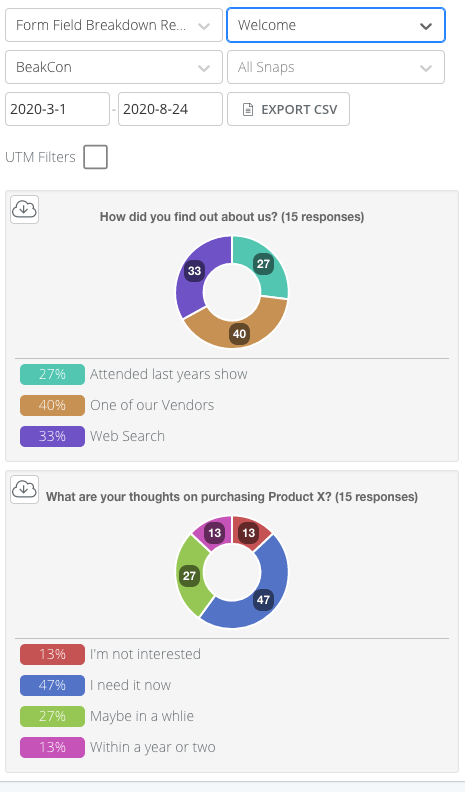
As our Forms features are so flexible, and each Form is custom designed for your specific use case, you need a fast way to see all your collected information in an easy-to-digest format. The Form Field Breakdown Report does exactly this!
This report will chart any of your questions that have a quantifiable response, that is, anything that isn't a free text entry.
For example, a "How did we do" question with a one to ten scale, or any question with a dropdown choice response will show up here.
Form Response Report
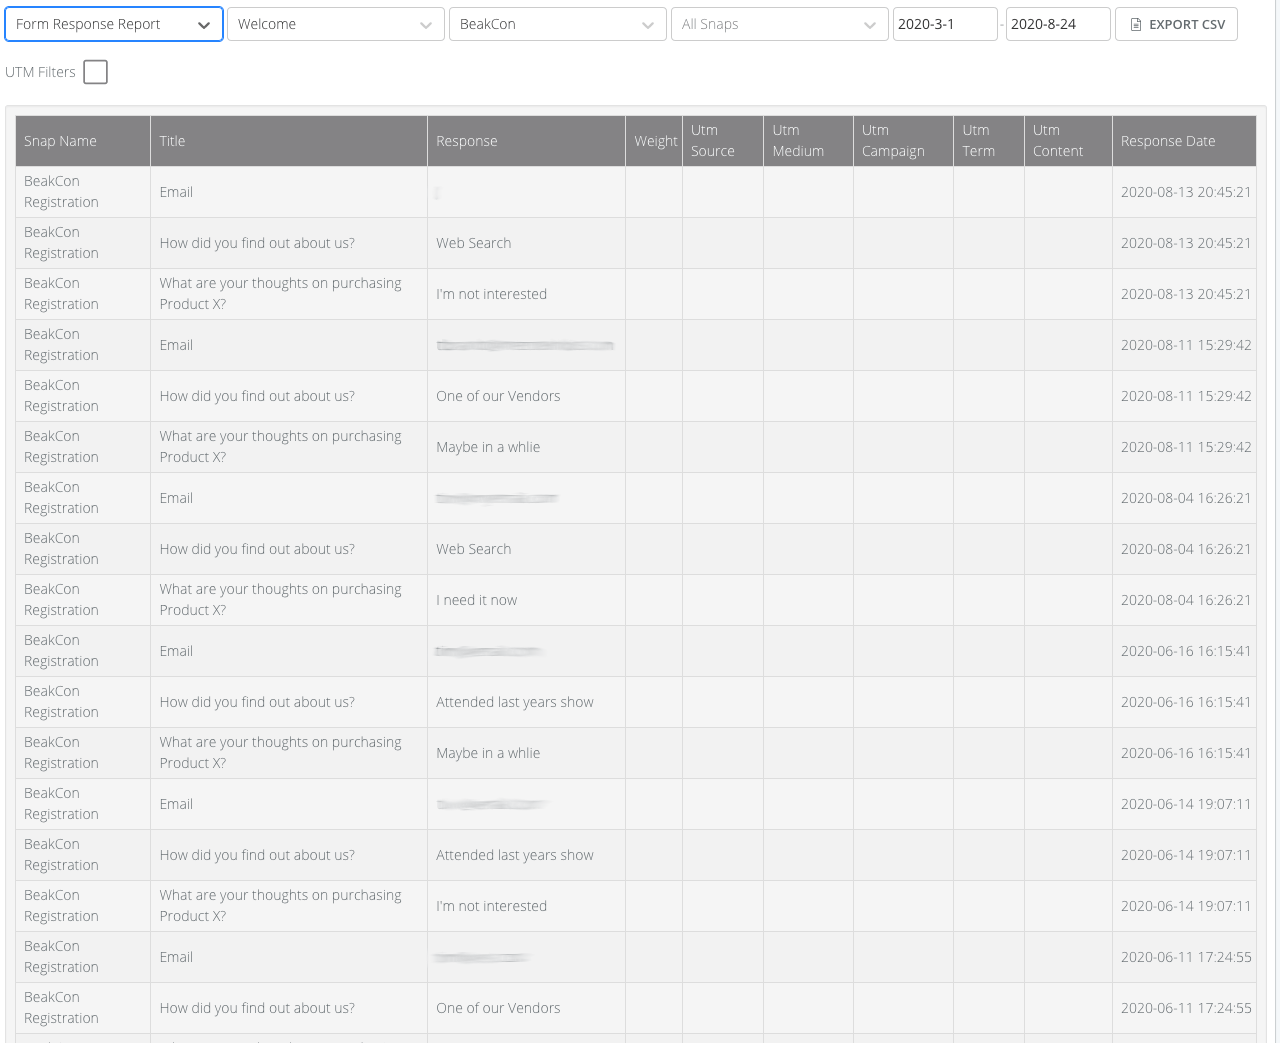
This report allows you to view all of your Form responses, including the free text responses which aren't included in the Form Field Breakdown report.
For example, capturing email addresses, paragraph responses, comments, etc.
Traffic Source Report
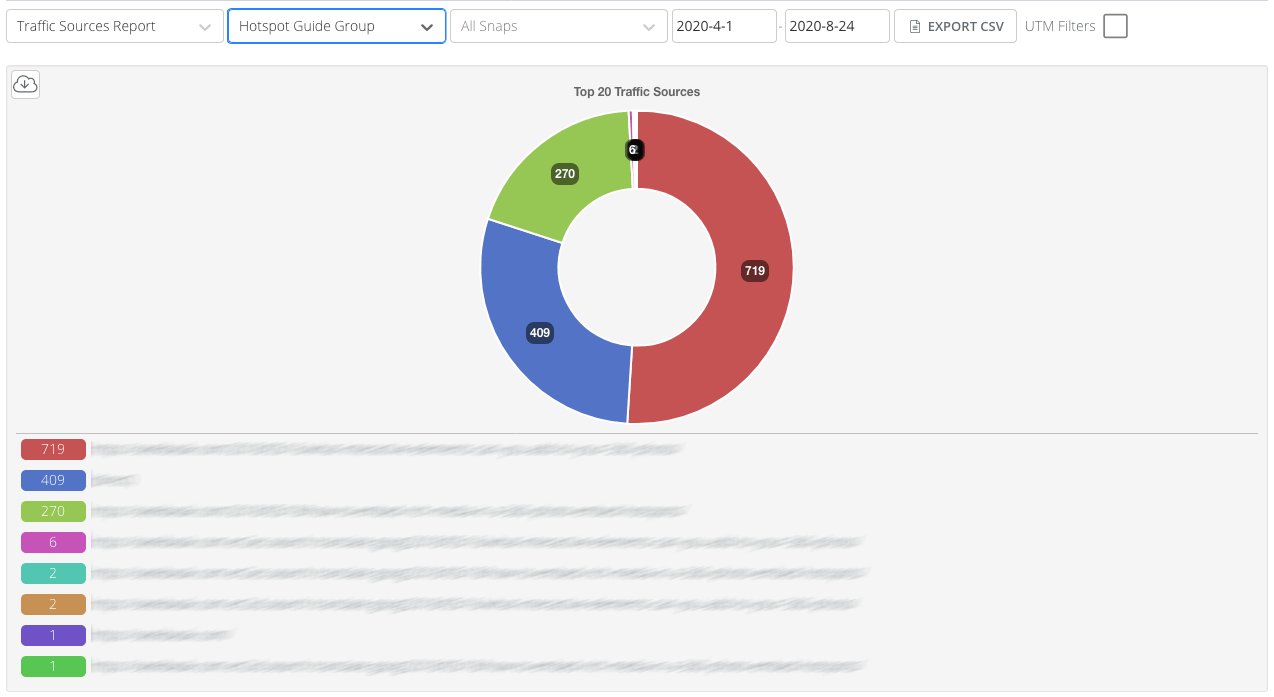
This report shows you where your traffic is coming from. Your top 25 referring domains and URLs are posted here. Now you can see if that blog post is performing better than an embed on social media channels!
Scheduled Group Summary Report
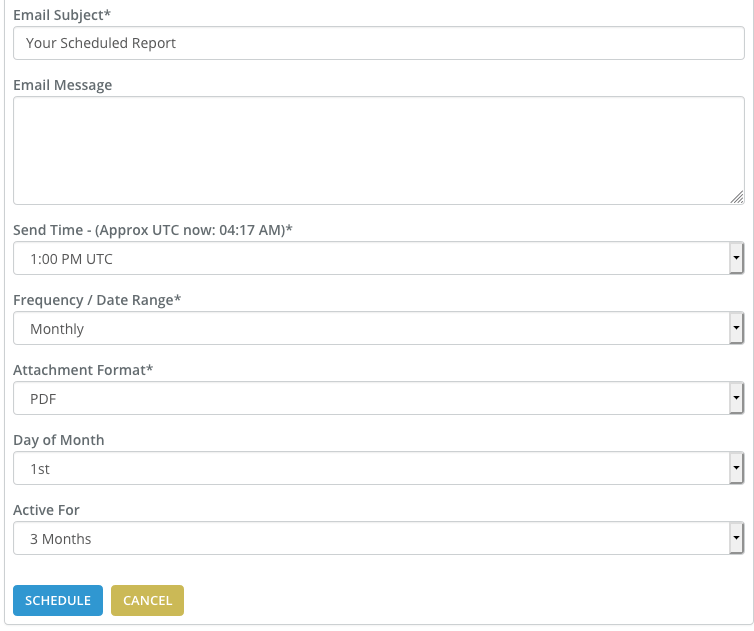
Create your own scheduled reports, which can be instantly emailed to any of (or all!) of the Team Members on your Team!
Reports can be tailored to your specific needs, and are delivered like clockwork.
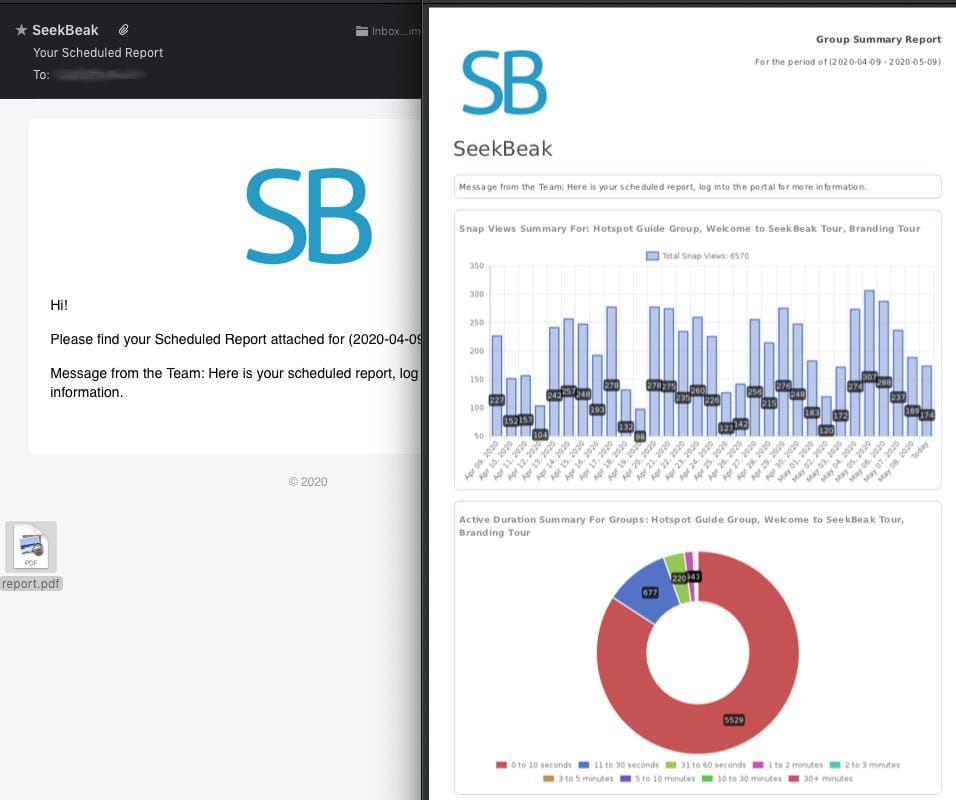
The Group Summary Reports are delivered as PDF attachments, containing summary information on Snap Views and Active Durations for your selected Groups of content.
If you see something interesting, and want to dig a bit deeper, simply dive into the Reporting tab in your SeekBeak account to get the nitty gritty details.