Heatmap Reporting Analytics for your 360 Images and Photos
As people view your Snaps, we silently run integrated motion-logging software that we created. It runs in the background, and tracks where users look at in your image, saving the data to our servers.
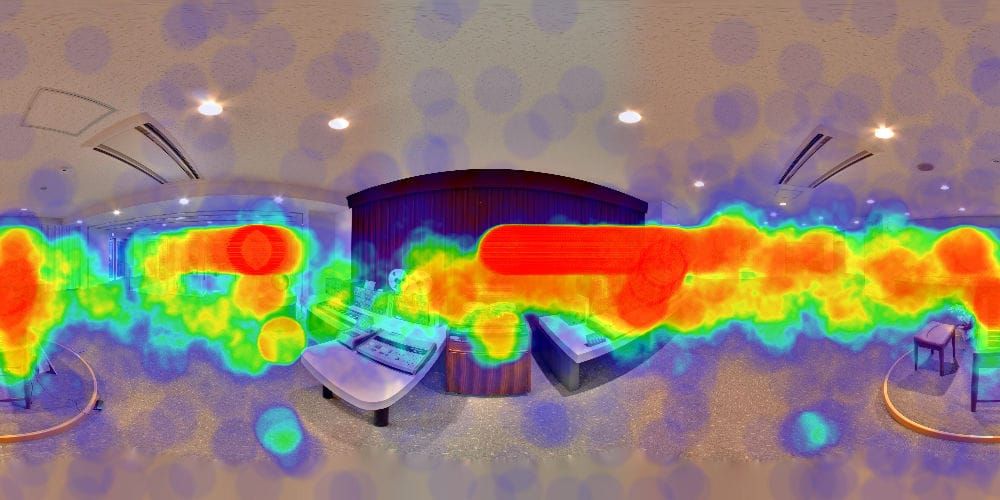
Using this gathered data, we are able to graph it into a Heat Map, which we can then overlay on top of your image. Red shows where more time was spent (Hot), and blue shows the spots where the least amount of time (Cool) was spent viewing. This makes it very easy to see exactly what people are spending time looking at in your Snaps, showing your potential what's working, and what's not.
Realtime Tweaking
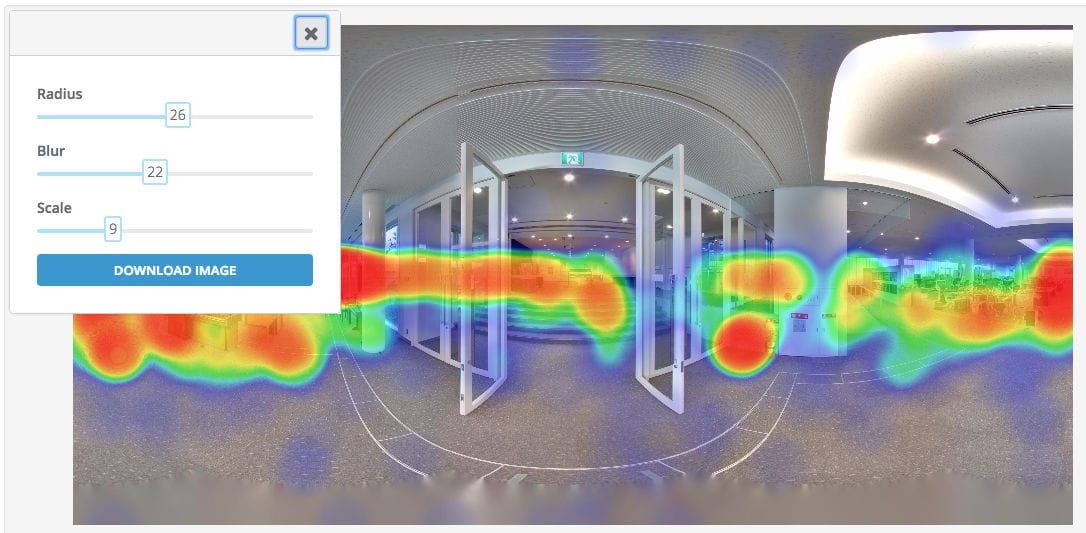
People like different things, and so we allow for some real-time changes of the chart to suit your style: You can adjust the radius of the blobs, the overall blur / blending, as well as the scale of the entire chart. i.e. It takes more / less view time for a section to register as 'red'.
Once you've got it looking the way you want, you can easily download the image to show your client, a supervisor, the neighborhood kids, or anyone else who might be interested.
Available Now.
For the folks on the plans that include this report, you'll find it in the Reporting area. The heat map logging component runs automatically for all viewers of your Snaps, so there's nothing you need to activate.
Note that the logging does not run while you are editing your Snap, so you only get data from actual views!
See It In Action
We think it's an amazing visual tool to show you what is grabbing attention in your photo.
Below you'll find a quick video explaining how to access this special report. Here are some quick ways you can use it:
- Find out what part of your home tour is most engaging for potential buyers. Once you know this, use this in your marketing materials and even set the default view to that specific spot in the 360 photo
- Compare icon effectiveness. See if a new icon or animation is better at drawing attention.
- See where people naturally gravitate to, and place hotspots in those areas.
- Download the heatmap and attach it to your client reports giving a visual representation of the traffic and the work that you are doing!