Hi gang,
I’m pleased to announce the first iteration of our new 360º Heatmap Analytics report!
“A what report!?”, you might ask. Well, first some background:
A few weeks ago, we rolled over some fancy new motion-logging software that we created. It runs in the background when people are viewing your Snaps, and tracks where users look in your image, periodically saving the data to our servers.

Pointillism Generator?
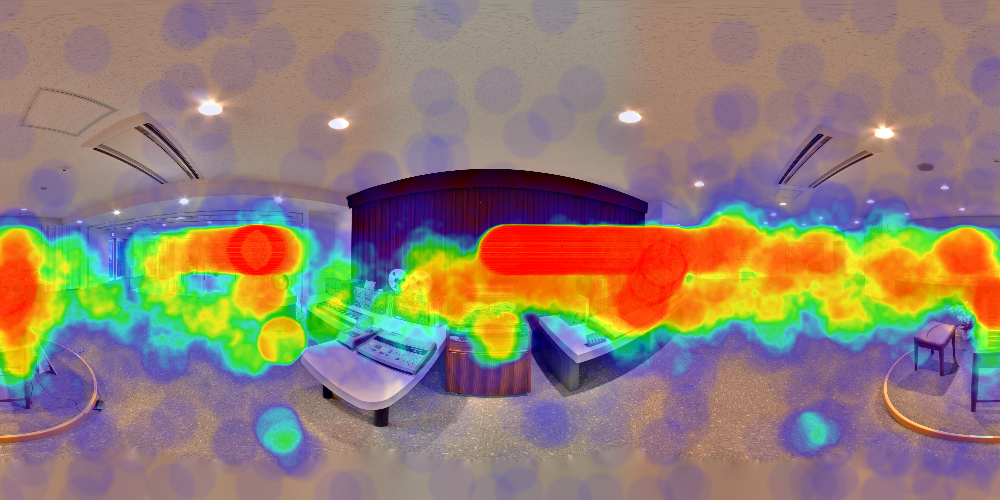
Using this gathered data, we are able to graph it into a Heat Map, which we can then overlay on top of your image.
Red shows where more time was spent (Hot), and blue shows the spots where the least amount of time (Cool) was spent viewing.
This makes it very easy to see exactly what people are spending time looking at in your Snaps, showing your potential what’s working, and what’s not.

Realtime Tweaking.
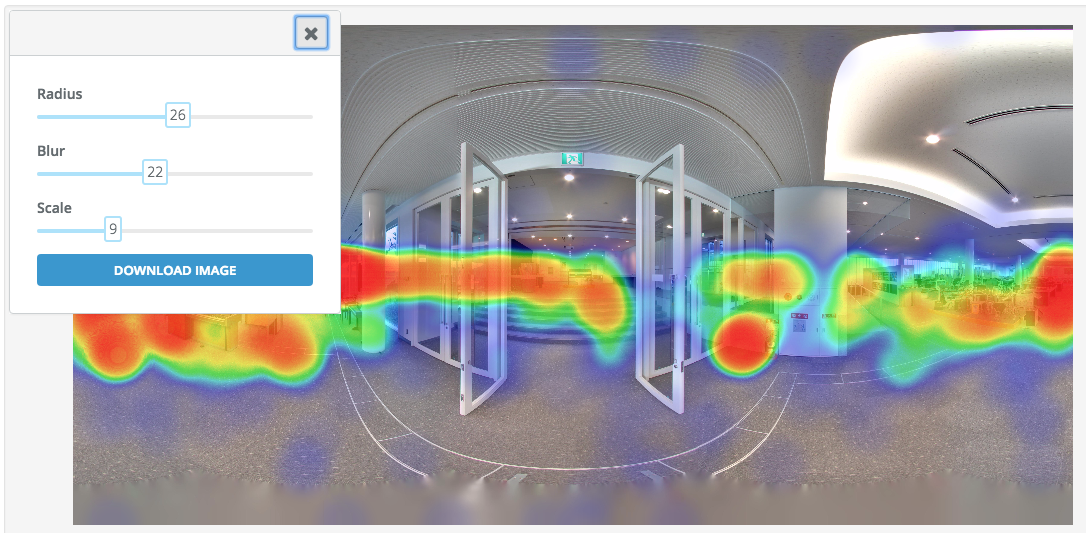
People like different things, and so we allow for some real-time changes of the chart to suit your style: You can adjust the radius of the blobs, the overall blur/blending, as well as the scale of the entire chart. (i.e. It takes more/less view time for a section to register as ‘red’).
Once you’ve got it looking the way you want, you can easily download the image to show your client, a supervisor, some neighborhood kids, or anyone else who might be interested.

Available Now.
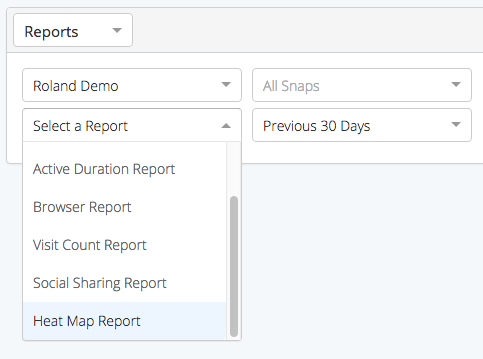
For the folks on the plans that include this report, you’ll find it in the Reporting area of your Dashboard. People on the plans that don’t include it can update their plans at any time and get access immediately.
The heat map logging component runs automatically for all people viewing your Snaps, so there’s nothing you need to activate.
Note that the logging does not run while you are editing your Snap, so you only get data from actual views.
That’s it for now, till next time!
Cheers,
Tim Allan
Founder/CEO
SeekBeak.com

A Guide to SeekBeak's Reports – Powerful Data Analytics for 360 Photos – SeekBeak – Virtual Tour & 360 Image Creator says:
[…] Hotspot Reports are a very unique feature of SeekBeak. We’re the only platform that allows you to see where exactly your audience viewed in the 360 photo. You’ll be able to spot particular points of interest to users, and where they lingered. Use the “gear” icon in the top left to control the size of the hotspots. For more information on Heatmaps, click here. […]
A Guide to Reports – Powerful Data Analytics for 360 Photos – VR 360 Hosting says:
[…] Hotspot Reports are a very unique feature of SeekBeak. We’re the only platform that allows you to see where exactly your audience viewed in the 360 photo. You’ll be able to spot particular points of interest to users, and where they lingered. Use the “gear” icon in the top left to control the size of the hotspots. For more information on Heatmaps, click here. […]